
Sequencing the SARS Virus
In April 2003, we at the Genome Sciences Centre (GSC) publicly released the first complete sequence assembly of the coronavirus now believed to be the cause of Severe Acute Respiratory Syndrome (SARS). The GSC has been using Linux for all of its analysis, storage and network infrastructure since its inception in 1999. The sequence data from the SARS Project was stored, processed and publicly distributed from a number of Linux servers, from the capable and slim IBM x330 to the behemoth eight-way Xeon x440. Linux has provided a flexible infrastructure allowing us to automate nearly every process in our sequencing pipeline. With the support of the Linux community, by way of newsgroups, Web articles and HOWTOs, we have been able to leverage commodity and mid-range hardware in an incredibly cost-efficient manner.
Since the first documented incidence of SARS on November 16, 2002, the virus has been responsible for a total of 8,458 cases reported in China (92%), Canada (3%), Singapore (2%) and the United States (1%), as well as in more than 25 other countries. SARS mortality rate is roughly 5–10% and as high as 50% in people older than 60. As of June 24, 2003, SARS has claimed 807 lives and has had a profoundly negative impact on the economies of the affected regions—China alone stands to lose billions of dollars in revenue from tourism and taxation.
On March 27, 2003, the director of our Centre, Marco Marra, and our project leader, Caroline Astell, decided to sequence the SARS coronavirus. At 1AM on April 7, 2003, approximately 50ng of genetic material from the Tor2 isolate of the pathogen, derived from a patient in Toronto, Canada, arrived from the Level 4 National Microbiology Lab in Winnipeg, Canada. Five days later, on April 12, 2003, our 29,751 base assembly of the sequence of the Tor2 isolate (Tor2/SARS) of the coronavirus was posted to a Zope/Plone page on our Apache server for public access. A few days later, the sequence of the Urbani isolate was posted by the (Centers for Disease Control) CDC in Atlanta, Georgia.
Before the 1990s, technology to collect large amounts of sequence information rapidly did not exist. The Human Genome Project (HGP) began in 1991, and by 1999 only 15% of the sequence had been collected. However, thanks to new methods, which were developed during the 1990s, the HGP turned sharply toward completion. By mid-2000, 90% of the human sequence was available, and currently the genome sequence essentially is complete. Data from sequencing projects like HGP is stored and publicly accessible through NCBI's Genbank.
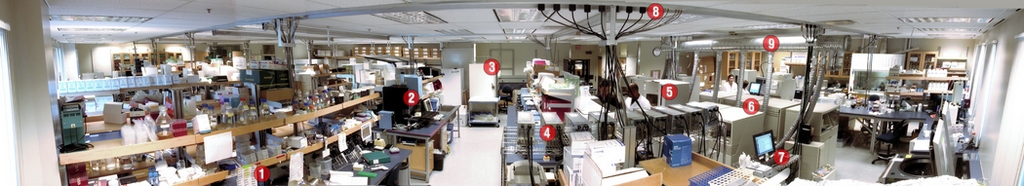
Figure 1. A panorama of our sequencing lab: 1) barcodes representing procedures, 2) the Tango liquid handling platform, 3) –112°F freezers, 4) power supplies for thermocyclers, 5) ABI 3730XL sequencers, 6) ABI 3700 sequencers, 7) x330 sequencer control cluster, 8) network/power connections and 9) vent ducts for sequencers.
During its first ten years of operation (1982–1992), Genbank collected just over 100MB of sequence in 80,000 records. During the next decade (1992–2002) Genbank's rate of growth skyrocketed, and the database grew to 29GB—ten times the size of the human genome—in 22 million records. Genbank receives on the order of 10,000 sequence records each day from sequencing labs across the world. One of these labs is the GSC, which on April 13, 2003, deposited the sequence of Tor2/SARS to Genbank. To see how Linux was involved in the process leading to the submission of sequence gi:29826276, we need to go back to the beginning.
In June 1999, the lab consisted of six beige-box computers and just as many people. The central file server (2xP3-400, 512MB of RAM, Red Hat 5.2 and 2.0.36 kernel) was serving out three RAID-0 18GB SCSI disks using a DPT IV card. Another 50GB of software RAID was exported by a second machine (P3-400). With three other Linux clients and a Microsoft Windows NT station, these machines were on the BC Cancer Agency (BCCA) network.
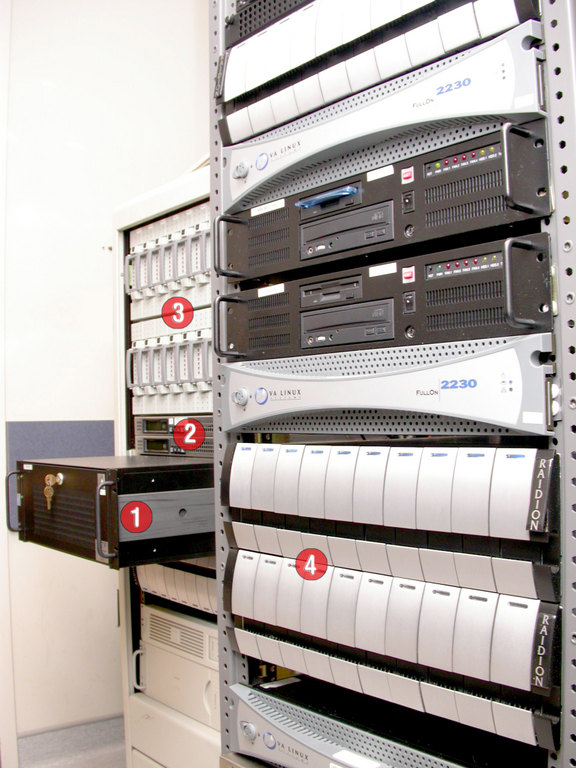
Figure 2. First-generation server hardware: 1) VA Linux VAR900 2xXeon-500 exporting 1TB, 2) Raidion.u2w RAID controllers, 3) 2x8x36GB SCSI disks and 4) VA Linux 2230s and 3x10x72GB SCSI disks.
The timing of our beginnings worked to our advantage. Like all research labs, we needed to share disks, distribute processes, compile software and store and munge data. In other words, all the things at which UNIX excels. Had we started 2–3 years earlier, adopting the fledgling Linux would have been difficult. It's likely that, instead of now relegating inexpensive old PCs to office or less-intensive network tasks, we would be trying to maximize return on our substantial investment of aging Sun servers. Fortunately, it turned out that it was possible to buy the relatively inexpensive PCs, install Linux and have a robust, flexible and incredibly cost-effective UNIX environment. Thanks to Linux, it was no longer necessary to spend an entire salary on a UNIX workstation.
It was a good time to choose Linux. The 2.0 kernel was rock solid; the NFS server was stabilizing, and a choice of full-featured desktop environments was available. We were able to download or compile the essential toolbox for bioinformatics analysis, such as the open-source workhorses of the HGP: BLAST (sequence comparison), Phred (base calling of traces produced by sequencers), Phrap (sequence assembly) and Consed (visualization of sequence assemblies), as well as various sequence and protein databases. Of course, Perl filled in any cracks. Our cost of entry into getting computational work done was low, and we could spend grant funds more efficiently to expand the lab (Figure 1).
In the fall of 1999, we received our first DNA sequencer, the MegaBACE 1000 (Figure 6). A sequencer determines the specific base sequence of a DNA sample, though technology currently is limited to determining only 500–800 bases accurately at a time. This read length is much shorter than the size of even the smallest genomes (Tor2/SARS is 30,000 bases in size). Consequently, sequencers simultaneously process 96 samples at a time, and some can be loaded with multiple 96- or 384-well plates.
The MegaBACE is a SCSI device, and the Applied Biosystems (ABI) 3700 and 3730XL sequencers (Figure 6) are controlled through a serial interface and send their data across an Ethernet connection. Although these sequencers acquire large amounts of data in an automated fashion, their software is a point-and-click Windows application. The ABI machines stream their data to a bundled local Oracle database. A UNIX-based control application would revolutionize the deployment of these machines, particularly in large labs. We already have reduced the maintenance complexity of the 3700s by deploying the IBM x330s to replace the original PCs that shipped with the sequencers (Figure 6). Integrating the Windows sequencing platform into a Linux network was the perfect job for smbmount, rsync, Perl and Apache. At the end of each sequence run, the operator triggers a Web-controlled data mirroring process to copy any new data onto the network disks.
After mirroring, the files are first converted from their proprietary format, which encodes the raw signal trace, to the actual bases and their associated quality measure and then are stored in a MySQL database (3.23.55max). Thus far we have collected about 2 million sequencing reads, or about 1TB of raw sequence data.
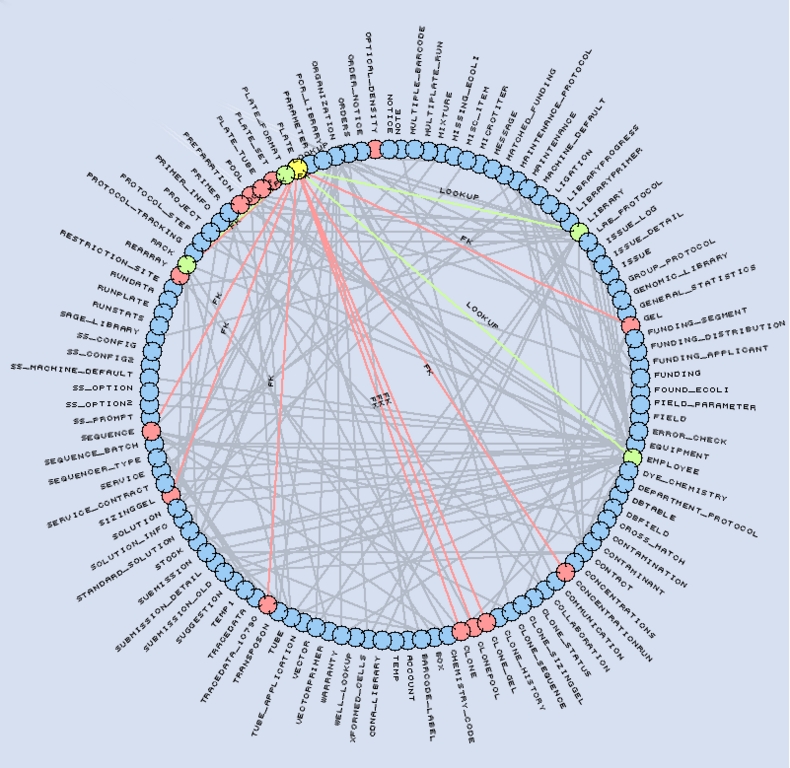
Figure 3. Representation of our LIMS schema. The Plate table (yellow) references four tables (green) and is referenced by 14 tables (red).
The MySQL Laboratory Information Management System (LIMS) database is central to our sequencing process. Its schema contains 115 tables, 1,171 fields and 195 foreign keys. The database tracks all reagents, equipment, processes and reactions performed in the lab. We circumvent MySQL's lack for native foreign key support by using application logic and a specific field naming convention. Foreign keys are named FKTYPE_TABLE__FIELD, indicating that they point to TABLE_FIELD in the table TABLE. The optional TYPE part of the foreign key name is used to support multiple keys to the same TABLE_FIELD.
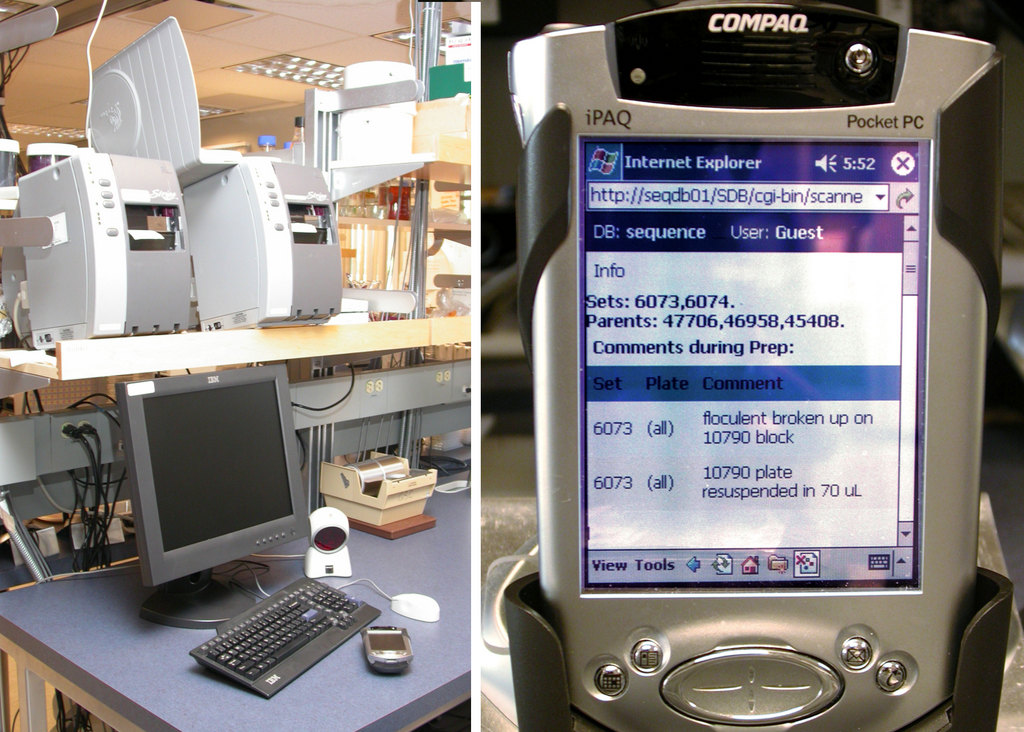
Figure 4. Barcodes are printed using networked Zebra printers (left). iPAQs provide a mobile interface into the LIMS (right).
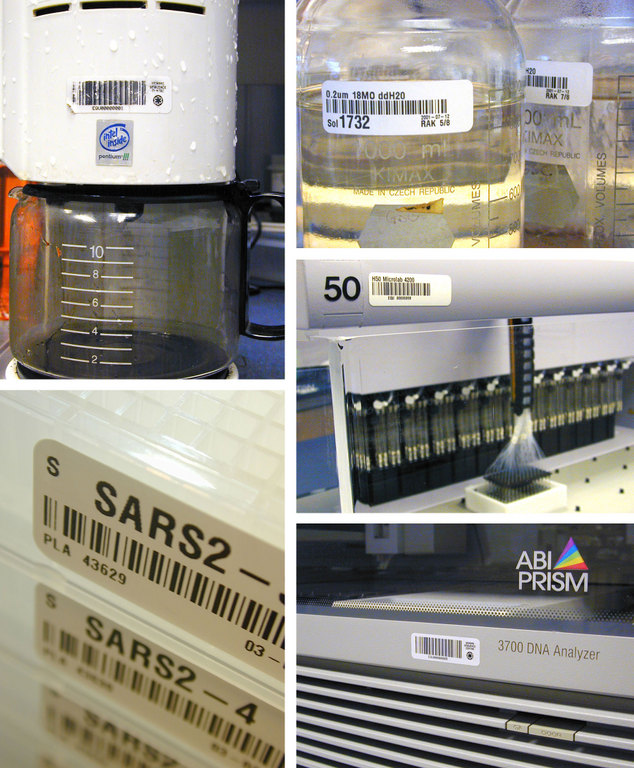
Figure 5. Nearly everything in the lab is barcoded.
Lab technologists interact with the LIMS database using Wi-Fi Compaq iPAQs outfitted with barcode scanners (Figure 4). The iPAQs connect to our internal Apache Web server powering a suite of mod_perl scripts. Objects such as solutions, plates and equipment are barcoded (Figure 5). Barcodes are printed on the networked Zebra S600/96XiIII barcode printers (Figure 4) fed with high-tack labels, which maintain adherence in our –112°F freezers. The barcoding software is written in Perl, uses the ZPL printer language to format the labels and distributes printing using lpr.
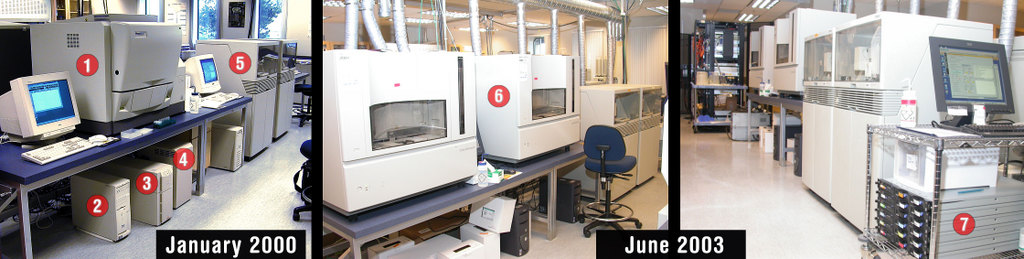
Figure 6. Sequencers: 1) MegaBACE 1000, 2) sequencer PC, 3) UPS, 4) sequencer power supply, 5) ABI 3700s, 6) ABI 3730XL and 7) x330 sequencer cluster.
Three generations of sequencers have passed through our lab since the MegaBACE 1000, and we currently operate six ABI 3700s and three ABI 3730XLs (Figure 6). The latest, the ABI 3730XL, is capable of accepting multiple 384-well plates and sequencing 1,152 DNA samples in 24 hours. With each sample yielding up to 700–800 high-quality bases, a single 3730XL produces about 800,000 bases per day.
The Tor2/SARS genome was sequenced using a whole-genome shotgun (WGS) method. In this approach, random sections of the genome are sequenced in a redundant fashion and then assembled together to recover the entire genomic sequence. Given that the size of the pathogen was anticipated to be approximately 30,000 bases, it would take a minimum of 40 reads to span the genome. However, because the reads originate from random regions, more than the minimum number of reads required in order to have enough overlap for a complete assembly. Redundancy also allows for more confidence in determination of the base at each given position in the genome.
By the time we bought our first set of IBM x330 servers, now part of a 168-CPU cluster (Figure 7), the 1U platform was on the verge of entering the commercial off-the-shelf (COTS) category and starting to enjoy COTS prices. Beige boxes are no longer used for distributed computing. Heavily loaded production subsystems, like Apache and MySQL, are housed on IBM's 4U x440s, which are eight-way hyperthreading Xeon nodes with 8GB of RAM. These boxes are running SuSE 8.1—one of the few distributions that supports IBM's Summit chipset. The x440 is a NUMA machine with 32MB of L4 cache per four-CPU module, and without IBM's Summit patches only presents two CPUs to the kernel. SuSE's 2.4.19 derived kernel with bigmem+Summit support makes it possible to use all eight CPUs and 8GB of memory. Even without the advanced NUMA scheduler code now in the 2.5 series kernels, these x440s have been real workhorses allowing us to run eight BLAST processes concurrently with enough RAM to cache the entire human genome in shared memory. Anyone who claims Linux isn't ready for Big Iron is in for a surprise.

Figure 7. Computing and storage infrastructure: 1) initial deployment of x330 in January 2001, 2) 84 x330 nodes and 3) NetApp FAS960 filer and two IBM 3583 LTO libraries with two drives and 72 slots each controlled by Veritas running on an x342.
As we rapidly grew, the NFS subsystem was beginning to show problems. In particular, machines were crashing with some combinations of NFS server/client versions. Although in our experience NFS clients are robust, room for improvement exists with current Linux NFS services. Our fastest NFS server, an IBM x342 (2xP3-1.24, 2GB RAM) cannot handle more than 4,000–6,000 NFS ops/second, especially during a large number of parallel read/writes from our cluster. To address the performance limits, we acquired a NetApp FAS960 Filer (Figure 7). With 10TB of raw storage (5x14x144GB), the filer has reached 30,000 NFS ops/second. Despite NFS issues, our original VAR900 production file server (Figure 2) was the poster child of stability and reached an uptime of 394 days in February 2002 before it had to be rebooted for upgrades.
The first set of Tor2/SARS sequence data was available for our informatics group to analyze on Friday evening, April 11, 2003. To verify our sequence reactions, we checked it for contamination. A BLAST search allowed us to determine the closest match in the public proteomic and genomic databases. To our relief, the best match was to bovine coronavirus (Figure 8), indicating that we were sequencing something related to coronaviruses. The sequences of these viruses end in a string of As, and when we saw sequence reads ending in a poly-A tail we were confident that this was one end of the genome.
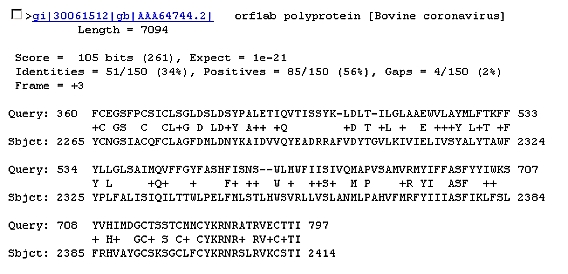
Figure 8. Output of the Top Hit from a BLAST Query
The x330s and an x440 were used to analyze and assemble the SARS data. The genome is not very large, and the assembly took less than 15 minutes on a single CPU. In comparison, the first public assembly of the human genome, 300,000 times the size of Tor2/SARS, was done at UCSC and took four days on a 100-CPU Linux cluster.
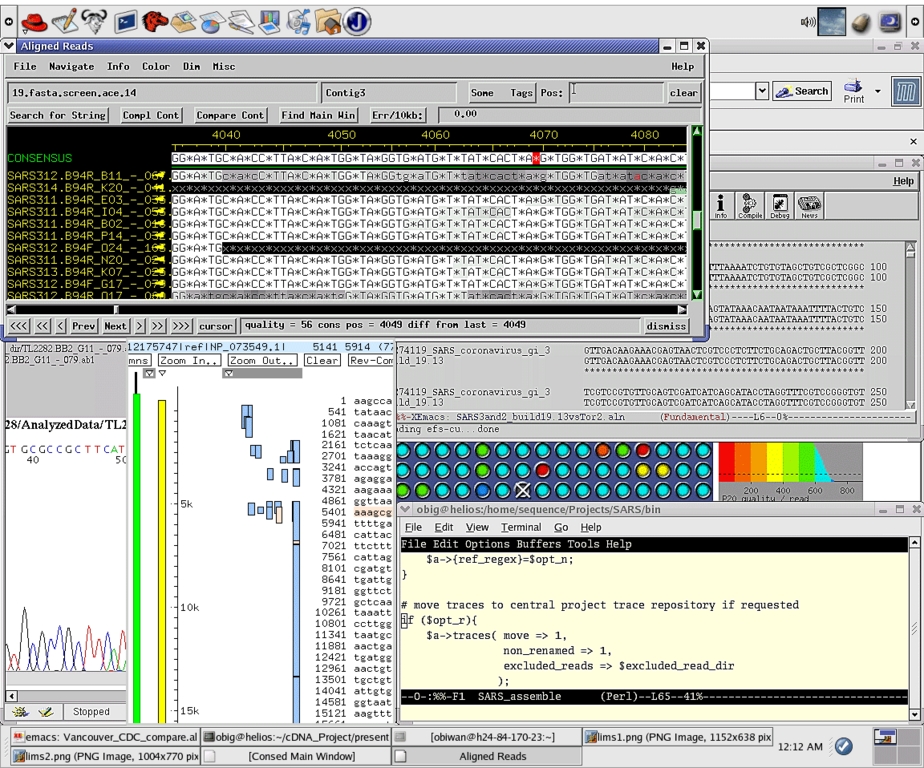
Figure 9. Sequence Analysis on the Linux Desktop
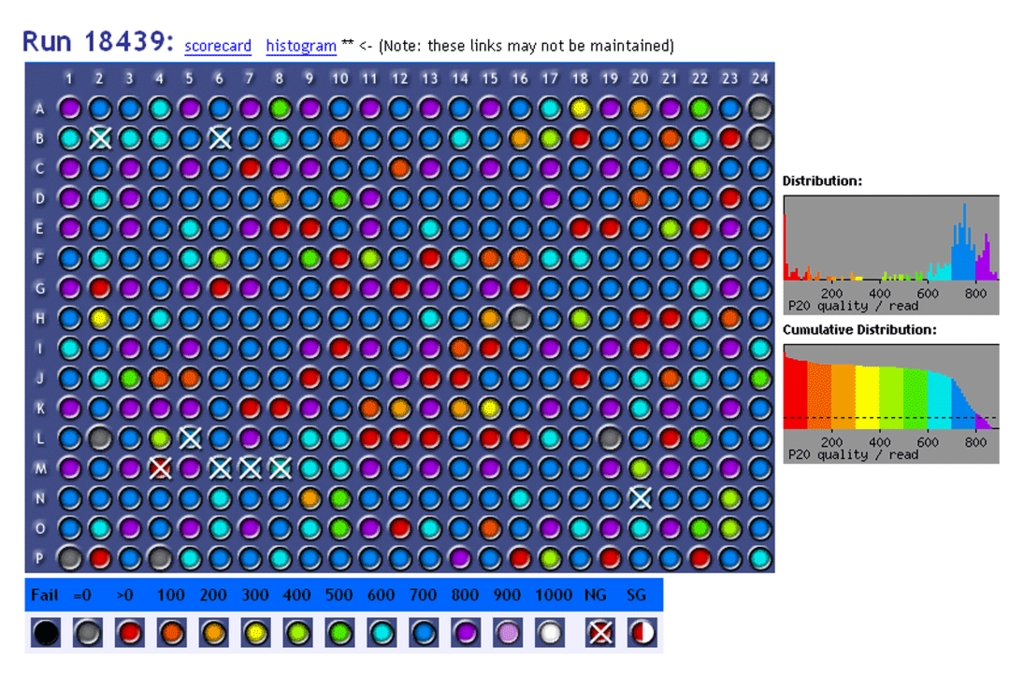
Figure 10. Sequence Read Quality for One of the SARS Plates
By Saturday, April 12, 2003, at 2:25AM, we completed our seventh build of Tor2/SARS, and this assembly was frozen as the first draft. It was imported into AceDB to visualize alignments to other known protein sets for validation (Figure 9). We spent Saturday validating the assembly, which was posted later that day to our x440 public Web server using a custom CMS system running under Zope/Plone.
The sequence of Tor2/SARS has identified a fourth novel group of coronaviruses and provides the necessary information to develop diagnostic tests and, possibly, therapies including a vaccine. Linux has made it possible to get our work done without spending a fortune on hardware or software. Using commodity hardware has minimized depreciation loss due to long implementation times. We'll be watching for new bugs to catch, and in the meanwhile, our MySQL database is open for sequencing.
The authors would like to thank Marco Marra, Steven Jones, Caroline Astell, Rob Holt, Angela Brooks-Wilson, Jas Khattra, Jennifer Asano, Sarah Barber, Susanna Chan, Allison Cloutier, Sean Coughlin, Doug Freeman, Noreen Girn, Obi Griffith, Steve Leach, Mike Mayo, Helen McDonald, Steven Montgomery, Pawan Pandoh, Anca Petrescu, Gord Robertson, Jacquie Schein, Asim Siddiqui, Duane Smailus, Jeff Stott and George Yang for scientific expertise, lab and bioinformatics efforts. We also would like to thank Kirk Schoeffel, Mark Mayo and Bernard Li for their system administration advice.
Command-Line Bioinformatics
Let's do some bioinformatics using bash and a few binaries out of /bin and /usr/bin. We will calculate the GC ratio of the Tor2/SARS genome—the fraction of base pairs that are either a G or a C. Let's avoid using awk to make things interesting. First, download the sequence with wget, using -q to silence its verbose output:
> wget -q http://mkweb.bcgsc.ca/sars/AY274119.fa
> head AY274119.fa
gi|30248028|gb|AY274119.3| SARS coronavirus TOR2
ATATTAGGTTTTTACCTACCCAGGA...
The sequence file is in FASTA format consisting of a header line and the sequence, split into fixed-width lines. The following counts the number of Gs and Cs in the sequence and presents the total as a fraction of the total number of bases:
> grep -v "^>" AY274119.fa | fold -w 1 |
tr "ATGC" "..xx" | sort | uniq -c |
sed 's/[^0-9]//g' | t -s "\012" " " |
sed 's/\([0-9]*\) \([0-9]*\)/scale = 3;
↪\2 \/ (\1+\2)/' |
bc -i
scale = 3; 12127 / (17624+12127)
.407
Out of the 29,751 bases in our sequence, 12,127 are either G or C, giving a GC content of 41%.
GSC MySQL LIMS
We collected 3,250 sequencing reads containing 2.1 million quality base pairs contributing toward the initial draft assembly. This represented roughly 70X redundant coverage of the genome. WGS is usually done to no more than 10X, but for us, time was of the essence, and we wanted to avoid delays associated with finishing regions that were not fully covered by the first round of sequencing.
SELECT
SUM(Sequence_Length) AS bp_tot,
AVG(Quality_Length) AS bpq_avg,
SUM(Quality_Length) AS bp_qual_tot,
COUNT(Well) AS reads,
Sequence_DateTime AS date,
Equipment_Name AS equip
FROM
Equipment, Clone_Sequence, Sequence_Batch, Sequence,
Plate, Library, Project
WHERE FK_Sequence_Batch__ID=Sequence_Batch_ID AND
FK_Plate__ID=Plate_ID AND
FK_Library__Name=Library_Name AND
FK_Equipment__ID=Equipment_ID AND
FK_Project__ID=Project_ID AND
FK_Sequence__ID=Sequence_ID AND
Sequence_Subdirectory like "SARS2%" AND
Quality_Length > 100 AND
Sequence_DateTime < "20030413"
GROUP BY Sequence_ID ORDER BY Sequence_DateTime;

bp_tot bpq_avg  bp_tot reads  date             equip
437256 612.6399 205847 336 2003-04-11 21:07:06 SARS212.B21 D3730-3
412366 752.1074 245187 326 2003-04-11 22:15:34 SARS213.B21 D3730-1
269456 639.1926 225635 353 2003-04-11 22:22:34 SARS215.B21 D3700-6
130525 715.5060 118774 166 2003-04-11 22:25:44 SARS216.B21 D3700-5
282490 682.6311 249843 366 2003-04-11 22:27:14 SARS215.BR D3700-4
310119 612.7601 212015 346 2003-04-11 22:31:56 SARS213.BR D3700-1
182573 681.4975 136981 201 2003-04-11 22:36:40 SARS216.BR D3700-3
301471 642.2273 226064 352 2003-04-12 01:58:16 SARS212.BR D3700-2
401595 690.5204 220276 319 2003-04-12 05:13:26 SARS211.BR D3730-3
460100 642.0468 219580 342 2003-04-12 06:20:52 SARS214.BR D3730-2
182360 471.7832  67465 143 2003-04-12 07:14:44 SARS214.B21 D3730-1
Resources
Growth of Genbank: www.ncbi.nlm.nih.gov/Genbank/genbankstats.html
How Perl Saved the Human Genome Project: bioperl.org/GetStarted/tpj_ls_bio.html
Image of a Coronavirus: www3.btwebworld.com/vdg/gallery/Coronavirus.jpg
SARS Issue of Science: www.sciencemag.org/feature/data/sars
SARS Statistics and Information: www.cdc.gov/ncidod/sars and lassesen.com/sars
Timeline of SARS History: www.worldhistory.com/sars.htm
UCSC Assembly of Human Genome: www.cse.ucsc.edu/~learithe/browser/goldenPath/algo.html
Martin Krzywinski (martink@bcgsc.ca) is a bioinformatics research scientist at Canada's Michael Smith Genome Sciences Centre. He spends his time applying Perl to problems in physical mapping and data-processing automation. In his spare time he can be found encouraging his cat to stick to her diet.
Yaron Butterfield (ybutterf@bcgsc.ca) leads the sequencing bioinformatics team at Canada's Michael Smith Genome Sciences Centre. He and his group develop DNA sequence analysis and visualization software and pipelines for various genome and cancer-based research projects.
